 CattleScale
How many cattle per acre? Stocking rates, DSE and carrying capacity in Australia
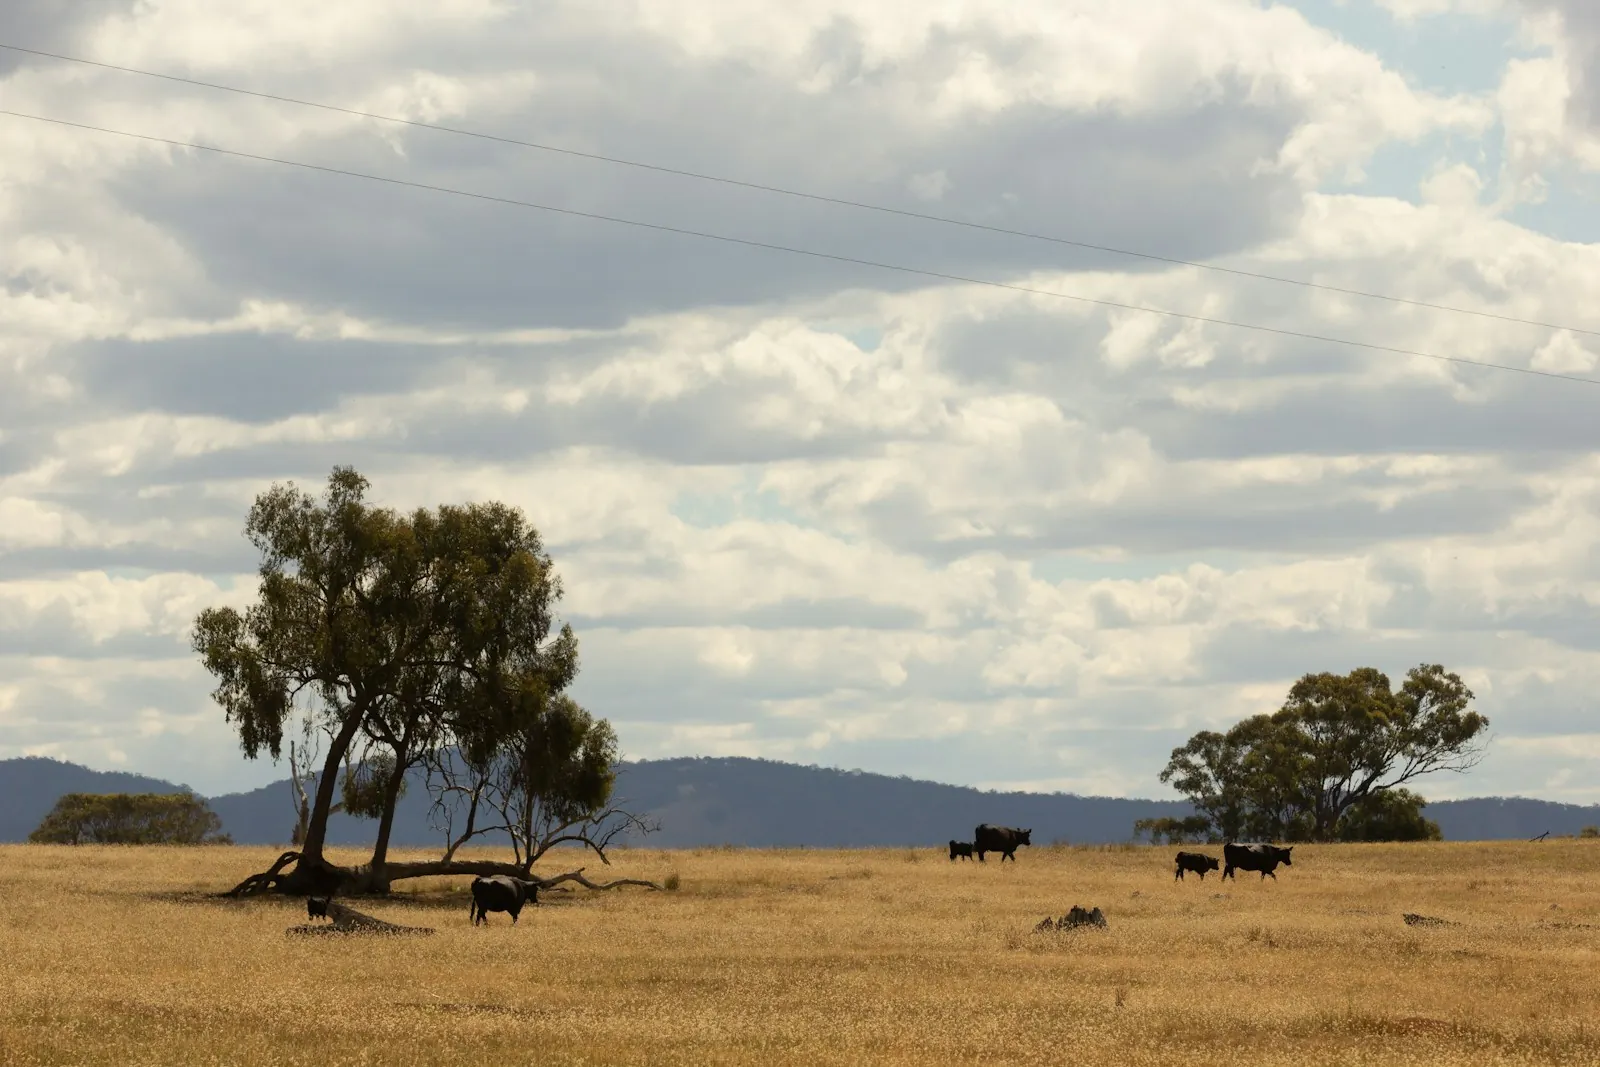
There is no single answer, but in NSW one 500 kg dry cow needs from about a third of a hectare (under 1 acre) on fertilised coastal pasture to about 16 hectares (40 acres) on low quality Southern Tablelands native pasture, and more again on degraded western country, by our arithmetic from NSW Department of Primary Industries carrying capacity figures. In the drier north, a long-running Queensland trial stocked moderately at 8 to 10 hectares (about 20 to 25 acres) per adult equivalent (O'Reagain and Bushell 2011). Rainfall, pasture type, land condition and the size of your cattle decide where your paddock sits.
Why is there no single answer to how many cattle per acre?
A paddock carries cattle by growing feed, and feed depends on rain, soil, pasture species, fertiliser and the state of the land. NSW DPIRD's own estimates of long-term carrying capacity run from 0.25 DSE per hectare on degraded pasture near Walgett to 14 to 24 DSE per hectare on fertilised coastal kikuyu, paspalum and clover (NSW DPIRD 2022). That is close to a hundredfold difference (our arithmetic).
Rainfall is the big one. At the Wambiana trial near Charters Towers, rainfall "largely drives year-to-year variation in pasture mass and ground cover", and annual rainfall nearby ranged from 207 mm to 1,409 mm around a 643 mm average (O'Reagain and Bushell 2011). NSW DPIRD also warns that in drought and in drier western country, DSE comparisons can be inaccurate, and the safe number of cattle may be lower than the DSE total suggests (NSW DPIRD 2022).
Land condition matters too. In Western Australia's rangelands, pastures in fair condition are rated two thirds as productive as good condition pastures, and poor condition pastures less than half as productive (DPIRD WA 2025).
Stocking rate vs stocking density vs carrying capacity
- Carrying capacity is supply: how much stock the land can feed. Long-term carrying capacity is the average a pasture can support over 10 to 15 years (Meat & Livestock Australia n.d.). WA's department puts it simply: "Carrying capacity is about land capability, while stocking rate is a management decision" (DPIRD WA 2025).
- Stocking rate is demand: the number of animals or DSE actually grazing an area (Meat & Livestock Australia n.d.). In northern Australia it is usually written as hectares per AE or AE per square kilometre (Meat & Livestock Australia 2021).
- Stocking density is how many animals are on one paddock at one moment. University of Georgia Extension's example: 15 cows on a 60 acre farm is 4 acres per cow. Split it into four 15 acre paddocks and rotate, and the stocking rate stays 4 acres per cow, but the stocking density is 1 acre per cow (Morgan et al. 2024).
"How many cattle per acre" is really a question about matching stocking rate to carrying capacity.
What is a dry sheep equivalent (DSE)?
NSW defines 1 DSE as a 50 kg Merino wether, dry ewe or non-pregnant ewe maintaining its condition (Meat & Livestock Australia n.d.). Other animals are rated by their feed energy needs compared with that sheep, which depend on liveweight, growth and whether the animal is pregnant or feeding a calf.
Note that some systems, including the northern AE tables, use a 45 kg wether as the DSE instead (DPIRD WA 2026; NSW DPIRD 2022). Do not mix figures from the two.
DSE table for cattle
| Class of cattle | Lighter | Heavier |
|---|---|---|
| Weaned calf gaining 0.25 kg/day | 5.5 DSE at 200 kg | 6.5 DSE at 250 kg |
| Weaned calf gaining 0.75 kg/day | 8.0 DSE at 200 kg | 9.0 DSE at 250 kg |
| Yearling gaining 0.25 kg/day | 7 DSE at 400 kg | 8 DSE at 500 kg |
| Yearling gaining 0.75 kg/day | 10 DSE at 400 kg | 11 DSE at 500 kg |
| Dry cow or steer, maintenance | 7 DSE at 400 kg | 8 DSE at 500 kg |
| Pregnant cow, last 3 months | 9 DSE at 400 kg | 11 DSE at 500 kg |
| Wet cow with 0 to 3 month calf | 14 DSE at 400 kg | 18 DSE at 500 kg |
| Wet cow with 4 to 6 month calf | 18 DSE at 400 kg | 22 DSE at 500 kg |
| Wet cow with 7 to 10 month calf | 22 DSE at 400 kg | 25 DSE at 500 kg |
Two things stand out. A cow and calf pair late in lactation needs about three times the feed of the same cow dry. And in every row, the heavier animal rates higher. As MLA puts it, "100 cattle are not always 100 cattle" (Meat & Livestock Australia n.d.).
What is an adult equivalent (AE)?
In northern and pastoral Australia, stocking rate is measured in adult equivalents. The standard animal is a 2.25 year old, 450 kg Bos taurus steer with no weight gain, walking 7 km a day, which needs 73 MJ of metabolisable energy a day. An animal's AE rating is its energy need divided by that standard. One AE equals 8.4 DSE, where the DSE is a 45 kg wether (DPIRD WA 2026).
The older method rated cattle by metabolic weight: liveweight raised to the power 0.75, divided by 450 kg raised to the same power (Paton, McLean and McLennan 2021). On that formula a 300 kg animal rates about 0.74 AE, a 500 kg animal about 1.08 and a 600 kg animal about 1.24 (our arithmetic). The updated method also counts growth and walking: a steer growing from 300 to 500 kg rated 0.92 AE under the old method but 1.44 under the new (Paton, McLean and McLennan 2021).
AE table for cattle classes
| Class | High | Moderate | Low |
|---|---|---|---|
| Females under 1 year | 0.77 | 0.68 | 0.57 |
| Females 4 years and over | 1.53 | 1.28 | 1.08 |
| Steers under 1 year | 0.8 | 0.72 | 0.6 |
| Steers 1 to 2 years | 1.31 | 1.03 | 0.78 |
| Steers 2 to 3 years | 1.6 | 1.27 | 1.02 |
| Bulls | 1.55 | 1.52 | 1.29 |
A mature cow is about 1.5 AE in a high production region but about 1.1 in a low one.
How many cattle per acre in Australia? Published carrying capacities
The table converts NSW DPIRD's carrying capacity ranges into dry 500 kg cows at 8 DSE each, using 1 hectare = 2.471 acres (National Institute of Standards and Technology n.d.).
| District and pasture | DSE per ha | Hectares per cow | Acres per cow |
|---|---|---|---|
| Coastal, improved pasture with fertiliser | 14 to 24 | 0.3 to 0.6 | 0.8 to 1.4 |
| Coastal, unimproved pasture | 3 to 6 | 1.3 to 2.7 | 3.3 to 6.6 |
| Southern Tablelands, low quality native | 0.5 to 1.5 | 5.3 to 16 | 13 to 40 |
| Southern Tablelands, sown perennial grass and legume | 6 to 14 | 0.6 to 1.3 | 1.4 to 3.3 |
| Northern Tablelands, natural pasture | 1.8 to 4.7 | 1.7 to 4.4 | 4.2 to 11 |
| Northern Tablelands, improved natural pasture | 4.2 to 9.1 | 0.9 to 1.9 | 2.2 to 4.7 |
| Northern Slopes, natural pasture | 1.2 to 3.8 | 2.1 to 6.7 | 5.2 to 16.5 |
| Southern Plains, sub clover and ryegrass | 1.0 to 2.5 | 3.2 to 8 | 7.9 to 19.8 |
The northern slopes and tablelands figures came from a survey of district agronomists; the rest are estimates (NSW DPIRD 2022). A cow with a calf needs two to three times the area shown.
How many cattle per acre in Queensland and the north?
Northern figures are in hectares per AE. At Wambiana, the moderate strategy, stocked at the long-term carrying capacity, ran at 8 to 10 ha per AE in most years, while the heavy strategy ran at about 4 to 5 ha per AE for its first eight years (O'Reagain and Bushell 2011). That is roughly 20 to 25 acres per AE at moderate stocking (our arithmetic).
In the Northern Territory's Barkly region, Creswell land type pastures in good condition carry an average 9 to 12 AE per square kilometre, but loss of perennial grasses after a recent lack of rain may have reduced that to about half (FutureBeef 2021). Nine to 12 AE per square kilometre is about 8 to 11 hectares, or 21 to 27 acres, per AE (our arithmetic).
Worked example: how many cows can my paddock carry?
These are illustrative numbers to show the steps, using the published ratings above.
- Measure the grazed area. A 40 hectare paddock is 40 × 2.471 = 98.8 acres. Leave out ground cattle will not graze; in the rangelands they normally stay within about 5 km of water (DPIRD WA 2025).
- Pick a carrying capacity. Say it is improved natural pasture on the Northern Tablelands. NSW DPIRD's average is 6.1 DSE per hectare (NSW DPIRD 2022).
- Work out total DSE. 40 ha × 6.1 = 244 DSE.
- Pick the DSE rating for your cattle. 500 kg dry cows at maintenance rate 8 DSE (Meat & Livestock Australia n.d.).
- Divide. 244 ÷ 8 = 30.5, so 30 cows. That is 1.3 ha (3.3 acres) per cow.
Now change the cattle, not the paddock (our arithmetic):
- 500 kg cows with calves 0 to 3 months old, at 18 DSE: 244 ÷ 18 = 13.6, so 13 pairs, about 3.1 ha (7.6 acres) per pair.
- Same cows, calves 7 to 10 months old, at 25 DSE: 244 ÷ 25 = 9.8, so 9 pairs.
- 400 kg dry cows at 7 DSE: 244 ÷ 7 = 34.9, so 34 cows.
Plan around the leanest time of year. NSW DPIRD suggests working out demand month by month, because the number of stock in the most limiting feed period guides the maximum stocking rate (NSW DPIRD 2022).
Why does liveweight matter for stocking rate?
Heavier cattle need more feed, so they rate more DSE or AE. In the example, suppose you guessed your cows at 400 kg and stocked 34, but they really weigh 500 kg. You would be carrying 34 × 8 = 272 DSE on a paddock rated for 244, about 11 per cent overstocked (our arithmetic). Growing cattle move up the DSE table as they gain weight, so check the ratings again as a mob grows (Meat & Livestock Australia n.d.).
The best way to know is to weigh a sample over scales. If that is not practical, our guide to how much a cow weighs gives typical figures by age and breed, and how much a cow eats a day explains the feed side. CattleScale can give a rough liveweight from photos, with a range and a Low, Moderate or Good confidence rating. Be clear about its limits: in its first test on 70 scale weighed cattle, the typical error was about 23 per cent, and the true weight fell inside the shown range about four times in ten. It is an estimate, not a weigh scale, so it can help you pick a row in the DSE table, but use scales where precision matters.
What are the signs of overstocking?
At Wambiana, heavy stocking at twice the long-term carrying capacity was compared with moderate stocking at it (O'Reagain and Bushell 2011):
- Less grass and bare ground. Pasture mass and ground cover fell as stocking rate rose, and the heavy paddocks were "almost bare by the end of the dry season" in low rainfall years.
- Lighter cattle. Light to moderate stocking gave 30 to 50 kg more liveweight gain per animal each year, and after two years those cattle were generally 50 to 100 kg heavier.
- Drought feeding. Heavy stocking produced the most per hectare, but only by drought feeding in dry years.
- Lost perennial grasses and worse land condition. Pastures went from B to C minus condition and did not recover to B even when stocking was cut and rain was above average.
- More run-off and erosion. Run-off was more frequent and intense, and bed load (soil washed along the surface) increased sharply once ground cover fell below 50 per cent.
Over 12 years the heavy strategy had by far the lowest net present value and a negative gross margin in 6 of the 12 years (O'Reagain, Bushell and Holmes 2011). Moderate stocking "maintained pastures in B condition despite severe drought" (O'Reagain and Bushell 2011).
MLA advises keeping at least 70 per cent ground cover on low slopes and up to 100 per cent on steep, higher risk areas. At 40 per cent cover, topsoil losses can be around 4 mm a year, against 0.3 mm a year at 70 per cent, and each millimetre is about 9 tonnes of soil per hectare (Meat & Livestock Australia 2006).
A quick stocking rate checklist
- Start from a published carrying capacity for your district, then adjust with your own records.
- Rate cattle by class and liveweight, and count cows and calves as pairs.
- Budget for the leanest season.
- Watch ground cover, perennial grasses and body condition, and destock early when they slip.
Frequently asked questions
How many acres per cow do you need in Australia?
It depends on rainfall and pasture. On NSW figures, a 500 kg dry cow needs from under 1 acre on fertilised coastal pasture to about 40 acres on low quality Southern Tablelands native pasture, and more on degraded western country (our arithmetic). Moderate stocking in a north Queensland trial was 20 to 25 acres per adult equivalent.
How many acres per cow calf pair?
A 500 kg cow with a young calf rates 18 DSE, rising to 25 DSE when the calf is 7 to 10 months old, against 8 DSE for the same cow dry. So a pair needs roughly two to three times the area of a dry cow.
What is the difference between stocking rate and stocking density?
Stocking rate is the number of animals over a whole area for a period. Stocking density is how many are on one paddock at one time. Rotational grazing raises density without changing the rate.
How many DSE is a cow?
A 400 kg dry cow at maintenance is about 7 DSE and a 500 kg one about 8 DSE. A pregnant cow rates 9 to 11 DSE and a cow with a calf 14 to 25 DSE, depending on weight and calf age.
What is an adult equivalent in cattle?
One AE is a 450 kg Bos taurus steer at maintenance, walking 7 km a day. Other cattle are rated by their energy needs compared with that steer, and one AE equals 8.4 DSE when the DSE is a 45 kg wether.
References
- DPIRD WA (2025) 'Carrying capacity: definitions for the Western Australian Rangelands', Department of Primary Industries and Regional Development, Western Australia. Available at: https://www.dpird.wa.gov.au/siteassets/documents/soil/carrying-capacity-definititions-rangelands-wa.pdf (Accessed: 5 October 2026).
- DPIRD WA (2026) 'What are Animal Equivalents?', Department of Primary Industries and Regional Development, Western Australia. Available at: https://www.dpird.wa.gov.au/siteassets/documents/soil/what-are-animal-equivalents.pdf (Accessed: 5 October 2026).
- FutureBeef (2021) 'How many cattle can the country carry?', FutureBeef. Available at: https://futurebeef.com.au/news/how-many-cattle-can-the-country-carry/ (Accessed: 5 October 2026).
- Meat & Livestock Australia (2006) 'Managing ground cover to reduce run-off and water loss', Tips & Tools, Meat & Livestock Australia. Available at: https://futurebeef.com.au/wp-content/uploads/Managing-ground-cover-to-reduce-run-off-and-water-loss.pdf (Accessed: 5 October 2026).
- Meat & Livestock Australia (2021) 'NB2 glossary', Meat & Livestock Australia. Available at: https://www.mla.com.au/globalassets/mla-corporate/research-and-development/program-areas/livestock-production/nb2-glossary-june21.pdf (Accessed: 5 October 2026).
- Meat & Livestock Australia (n.d.) '4: Determine carrying capacity and stocking rate', More Beef from Pastures: Pastoral, Meat & Livestock Australia. Available at: https://mbfp-pastoral.mla.com.au/managing-your-feedbase/determine-carrying-capacity-and-stocking-rate/ (Accessed: 5 October 2026).
- Morgan, S., Tucker, J.J., Baxter, L. and Burt, J. (2024) 'Understanding stocking rate in pasture systems', Bulletin 1568, University of Georgia Cooperative Extension. Available at: https://fieldreport.caes.uga.edu/publications/B1568/understanding-stocking-rate-in-pasture-systems/ (Accessed: 5 October 2026).
- National Institute of Standards and Technology (n.d.) 'NIST Guide to the SI, Appendix B.9: Factors for units listed by kind of quantity or field of science', NIST. Available at: https://www.nist.gov/pml/special-publication-811/nist-guide-si-appendix-b-conversion-factors/nist-guide-si-appendix-b9 (Accessed: 5 October 2026).
- NSW DPIRD (2022) 'Using DSEs and carrying capacities to compare sheep enterprises', Sheep gross margins April to September 2022, NSW Department of Primary Industries and Regional Development. Available at: https://www.dpird.nsw.gov.au/agriculture/budgets/livestock/sheep-gross-margins-april-september-2022/background/dse (Accessed: 5 October 2026).
- O'Reagain, P.J. and Bushell, J.J. (2011) The Wambiana grazing trial: key learnings for sustainable and profitable management in a variable environment. Agri-Science Queensland, Department of Employment, Economic Development and Innovation. Available at: https://era.dpi.qld.gov.au/id/eprint/8285/1/The-Wambiana-grazing-trial-key-learnings-November-2011.pdf (Accessed: 5 October 2026).
- O'Reagain, P., Bushell, J. and Holmes, B. (2011) 'Managing for rainfall variability: long-term profitability of different grazing strategies in a northern Australian tropical savanna', Animal Production Science, 51(3), pp. 210 to 224. Available at: https://doi.org/10.1071/AN10106 (Accessed: 5 October 2026).
- Paton, C., McLean, I. and McLennan, S. (2021) 'Application of updated Animal Equivalent (AE) approach', presentation, FutureBeef. Available at: https://futurebeef.com.au/wp-content/uploads/2021/03/Application-of-updated-Animal-Equivalent-approach-PDF-1.87-MB.pdf (Accessed: 5 October 2026).